Introduction
Predicting Bitcoin prices is a challenging yet fascinating task due to the cryptocurrency's volatile nature. In this tutorial, I will guide you through the process of building a time series forecasting model using ARIMA to predict Bitcoin prices and convert the forecasted values to USD and IDR.
Packages Required
To get started, you'll need the following packages:
- pandas for data manipulation
- numpy for numerical operations
- statsmodels for statistical modeling
- matplotlib for plotting
- requests for fetching exchange rate data
You can install these packages in Google Colab using the following commands:
!pip install pandas numpy statsmodels matplotlib requestsStep-by-Step Guide
Step 1: Load the Data
First, we'll load the latest Bitcoin price dataset from Yahoo Finance.
import pandas as pd

# Load the dataset
url = 'https://query1.finance.yahoo.com/v7/finance/download/BTC-USD?period1=1451606400&period2=9999999999&interval=1d&events=history'
data = pd.read_csv(url, parse_dates=['Date'], index_col='Date')

# Display the first few rows
print(data.head()) Open High Low Close Adj Close \
Date
2016-01-01 430.721008 436.246002 427.515015 434.334015 434.334015
2016-01-02 434.622009 436.062012 431.869995 433.437988 433.437988
2016-01-03 433.578003 433.743011 424.705994 430.010986 430.010986
2016-01-04 430.061005 434.516998 429.084015 433.091003 433.091003
2016-01-05 433.069000 434.182007 429.675995 431.959991 431.959991
Volume
Date
2016-01-01 36278900.0
2016-01-02 30096600.0
2016-01-03 39633800.0
2016-01-04 38477500.0
2016-01-05 34522600.0Step 2: Visualize the Data
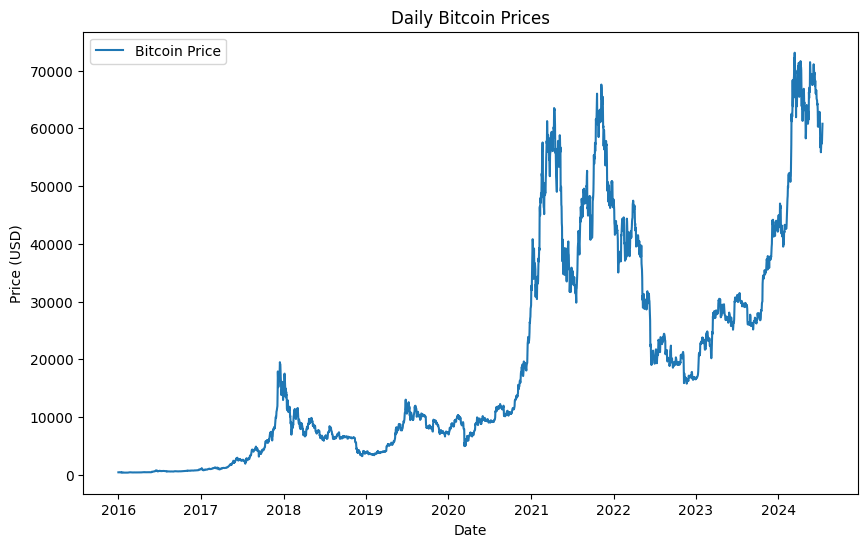
Visualizing the time series data helps to understand the trends, seasonality, and patterns.
import matplotlib.pyplot as plt

# Plot the time series data
plt.figure(figsize=(10, 6))
plt.plot(data['Close'], label='Bitcoin Price')
plt.title('Daily Bitcoin Prices')
plt.xlabel('Date')
plt.ylabel('Price (USD)')
plt.legend()
plt.show()
Step 3: Differencing the Data
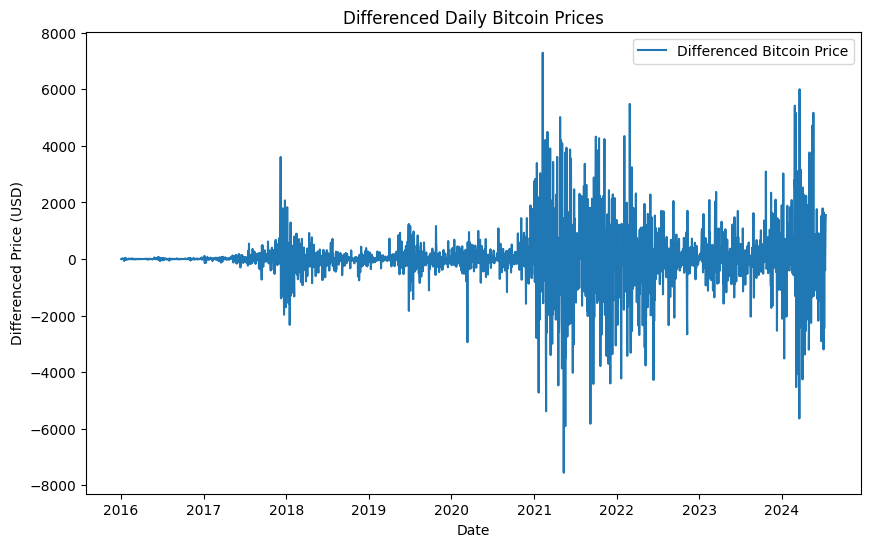
Differencing is used to make the time series data stationary, which is required for ARIMA modeling.
# Perform first-order differencing
data_diff = data['Close'].diff().dropna()

# Plot the differenced data
plt.figure(figsize=(10, 6))
plt.plot(data_diff, label='Differenced Bitcoin Price')
plt.title('Differenced Daily Bitcoin Prices')
plt.xlabel('Date')
plt.ylabel('Differenced Price (USD)')
plt.legend()
plt.show()
Step 4: Fit the ARIMA Model
Now, we can fit the ARIMA model to the differenced data. We'll use the ARIMA function from the statsmodels library.
from statsmodels.tsa.arima.model import ARIMA

# Fit the ARIMA model
model = ARIMA(data['Close'], order=(5, 1, 0))  # (p, d, q) parameters
model_fit = model.fit()

# Print the model summary
print(model_fit.summary()) SARIMAX Results
==============================================================================
Dep. Variable: Close No. Observations: 3120
Model: ARIMA(5, 1, 0) Log Likelihood -25710.140
Date: Tue, 16 Jul 2024 AIC 51432.279
Time: 03:16:46 BIC 51468.551
Sample: 01-01-2016 HQIC 51445.300
- 07-16-2024
Covariance Type: opg
==============================================================================
coef std err z P>|z| [0.025 0.975]
------------------------------------------------------------------------------
ar.L1 -0.0513 0.010 -5.339 0.000 -0.070 -0.032
ar.L2 0.0122 0.010 1.198 0.231 -0.008 0.032
ar.L3 0.0329 0.011 2.974 0.003 0.011 0.055
ar.L4 0.0363 0.009 3.887 0.000 0.018 0.055
ar.L5 0.0114 0.009 1.214 0.225 -0.007 0.030
sigma2 8.492e+05 8408.771 100.987 0.000 8.33e+05 8.66e+05
===================================================================================
Ljung-Box (L1) (Q): 0.03 Jarque-Bera (JB): 16897.89
Prob(Q): 0.86 Prob(JB): 0.00
Heteroskedasticity (H): 13.15 Skew: -0.04
Prob(H) (two-sided): 0.00 Kurtosis: 14.40
===================================================================================
Warnings:
[1] Covariance matrix calculated using the outer product of gradients (complex-step).Step 5: Forecasting
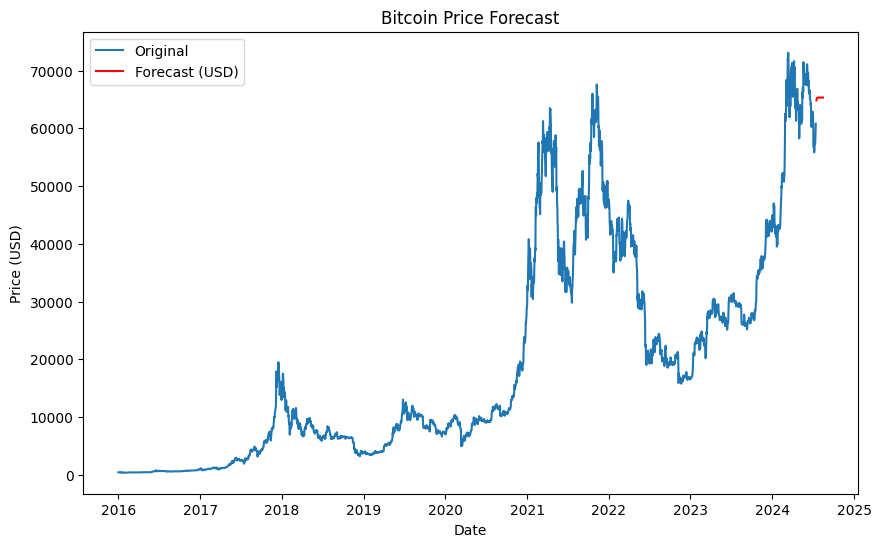
After fitting the model, we can use it to make forecasts.
# Make forecast
forecast = model_fit.forecast(steps=30)  # Forecasting for the next 30 days

# Plot the forecast
plt.figure(figsize=(10, 6))
plt.plot(data['Close'], label='Original')
plt.plot(forecast, label='Forecast (USD)', color='red')
plt.title('Bitcoin Price Forecast')
plt.xlabel('Date')
plt.ylabel('Price (USD)')
plt.legend()
plt.show()
Step 6: Convert Forecast to IDR
For converting the forecasted Bitcoin prices to IDR, we need the current exchange rate. We'll use the requests library to fetch the latest exchange rate from an API.
import requests

# Function to get USD to IDR exchange rate
def get_usd_to_idr_exchange_rate():
    try:
        response = requests.get('https://api.exchangerate-api.com/v4/latest/USD')
        data = response.json()
        return data['rates']['IDR']
    except Exception as e:
        print(f"Error getting exchange rate: {e}")
        return 14500  # Default exchange rate if API fails

# Get the exchange rate
exchange_rate = get_usd_to_idr_exchange_rate()
forecast_idr = forecast * exchange_rate

# Print forecasted values in USD and IDR
print("Forecasted Bitcoin Prices for the next 30 days (USD):")
print(forecast)
print("\nForecasted Bitcoin Prices for the next 30 days (IDR):")
print(forecast_idr)Forecasted Bitcoin Prices for the next 30 days (USD):
2024-07-17 64857.928145
2024-07-18 65018.188590
2024-07-19 65167.803824
2024-07-20 65261.151784
2024-07-21 65288.089636
2024-07-22 65298.841536
2024-07-23 65308.944573
2024-07-24 65314.532450
2024-07-25 65316.760778
2024-07-26 65317.743490
2024-07-27 65318.393172
2024-07-28 65318.762795
2024-07-29 65318.928459
2024-07-30 65319.006839
2024-07-31 65319.051756
2024-08-01 65319.076660
2024-08-02 65319.088722
2024-08-03 65319.094613
2024-08-04 65319.097798
2024-08-05 65319.099518
2024-08-06 65319.100384
2024-08-07 65319.100816
2024-08-08 65319.101043
2024-08-09 65319.101164
2024-08-10 65319.101226
2024-08-11 65319.101257
2024-08-12 65319.101273
2024-08-13 65319.101282
2024-08-14 65319.101286
2024-08-15 65319.101289
Freq: D, Name: predicted_mean, dtype: float64
Forecasted Bitcoin Prices for the next 30 days (IDR):
2024-07-17 1.050802e+09
2024-07-18 1.053398e+09
2024-07-19 1.055822e+09
2024-07-20 1.057334e+09
2024-07-21 1.057771e+09
2024-07-22 1.057945e+09
2024-07-23 1.058109e+09
2024-07-24 1.058199e+09
2024-07-25 1.058235e+09
2024-07-26 1.058251e+09
2024-07-27 1.058262e+09
2024-07-28 1.058268e+09
2024-07-29 1.058270e+09
2024-07-30 1.058272e+09
2024-07-31 1.058272e+09
2024-08-01 1.058273e+09
2024-08-02 1.058273e+09
2024-08-03 1.058273e+09
2024-08-04 1.058273e+09
2024-08-05 1.058273e+09
2024-08-06 1.058273e+09
2024-08-07 1.058273e+09
2024-08-08 1.058273e+09
2024-08-09 1.058273e+09
2024-08-10 1.058273e+09
2024-08-11 1.058273e+09
2024-08-12 1.058273e+09
2024-08-13 1.058273e+09
2024-08-14 1.058273e+09
2024-08-15 1.058273e+09
Freq: D, Name: predicted_mean, dtype: float64Conclusion
This tutorial provided a basic introduction to using ARIMA for time series forecasting of Bitcoin prices. Additionally, we demonstrated how to convert the forecasted values to USD and IDR using the current exchange rate.
Useful Links
- ARIMA Model
- Time Series Analysis
- Pandas Documentation
- Matplotlib Documentation
- Requests Documentation
By following these steps, you should be able to create a time series forecasting model using ARIMA and apply it to your own datasets, including Bitcoin prices.


